| 1. | Introduction | |
| 2. | Fundamentals of the Human Speech Production | |
| 3. | Basic Principle of an LPC Vocoder | |
| 4. | Vocoder Simulation | |
| 4.1 | Overview | |
| 4.2 | Instructions for the use of the program | |
| 5. | Concluding Remarks | |
This tutorial explains the principle of the human speech production with the aid of a Linear Predictive Vocoder (LPC vocoder) and the use of interactive learning procedures. The components of the human speech organ, namely the excitation and the vocal tract parameters, are computed. The components are then fed into the synthesis part of a vocoder which finally generates a synthesised speech signal. The user can replay the signal and compare it with the reference speech signal. For visual comparison the reference speech signal and the reconstructed speech signal are depicted in both the time and frequency domain. For the reconstructed signal, also the pitch frequency contour is graphically presented and the usercan directly manipulate this contour. The main advantage of the tutorial are its numerous interactive functions. The tutorial is based on HTML pages and Java applets and can be downloaded from the WWW.
1. Introduction
We present a tutorial in which the human speech production is interactively explained using the principle of a Linear Predictive Vocoder (LPC vocoder). The user speaks into a microphone, the voice is digitised and stored in the computer. A replay of the stored voice (e.g. for comparison purposes) is possible when appropriate. In addition, some speech samples are stored and can be replayed or processed. The voice components, namely the fundamental frequency and the vocal tract parameters, are computed. Then, the components are fed into the synthesis part of the vocoder which finally generates a synthesised speech signal. Now the user can replay the signal and compare it with the original speech signal. For visual comparison, the original speech signal and the reconstructed speech signal are depicted in both, the time and frequency domain. In addition, the fundamental frequency (pitch) contour is graphically presented.
The main advantage of the tutorial is it’s interactive modality. The user can, for example, manipulate the fundamental frequency contour, the number of prediction coefficients, the signal energy etc. and he or she can then hear the result of these manipulations.
Although the LPC vocoder is primarily a coding scheme, it can be optimally used as a model for the human speech production, and this is the main purpose of the tutorial. The student easily identifies that human speech is concatenated of the vocal cord signal (represented by the fundamental frequency signal) and the resonance characteristics of the mouth and nose cavity. It is not only instructive but also exciting to study both, the visual and the audible variations of the fundamental frequency in dependence of different speakers and emotions.
The tutorial is designed for students of various disciplines like communication engineering, physics, linguistics, phonetics, medicine, speech therapy a.s.o.. It requires some basic knowledge in signal processing. For example, the student should know how to read and interprete a time signal and a spectrogram.
We believe that the best way to understand the human speech production - in the scope of our tutorial - is to record the own voice and to start with a playful manipulation of the fundamental frequency (pitch). This gives a feeling how stress, emotion, speech dynamic and other characteristics are influenced by this frequency. Secondly, it is useful to vary the number of prediction coefficients which represent the formant frequencies (i.e. the resonance frequencies) of the articulation tract. For a visual and acoustic comparison, the unprocessed stored voice is helpful.
The tutorial is based on HTML pages and Java applets. It is available from our WWW server with a Netscape or Explorer browser, the WWW address is
http://www.kt.tu-cottbus.de/speech-analysis/
As to recording the own voice, we need a special software. For audio input, the shareware SoundBite of the Scrawl company is used which can be found in the WWW under http://www.scrawl.com/store/ . This tool is based on JNI (Java Native Interface) and requires the Netscape browser 4.04 (or higher) and the Windows platform. For the audio output we use sun.audio, which is part of common browsers. If there is no need (or interest) to record the own voice and to restrict on stored speech samples, no shareware is necessary.
2. Fundamentals of the Human Speech Production
Speech is produced by a cooperation of lungs, glottis (with vocal cords) and articulation tract (mouth and nose cavity). Fig. 1 shows a cross section of the human speech organ. For the production of voiced sounds, the lungs press air through the epiglottis, the vocal cords vibrate, they interrupt the air stream and produce a quasi-periodic pressure wave. For a short demonstration of the vibrating vocal cords please click on the video symbol under Fig.1.
The pressure impulses are commonly called pitch impulses
and the frequency of the pressure signal is the pitch
frequency or fundamental frequency. In Fig. 2a a
typical impulse sequence (sound pressure function) produced by
the vocal cords for a voiced sound is shown. It is the part of
the voice signal that defines the speech melody. When we speak
with a constant pitch frequency, the speech sounds monotonous but
in normal cases a permanent change of the frequency ensues. How
the pitch frequency variates is depicted in
Fig. 2b.
The pitch impulses stimulate the air in the mouth and for certain sounds (nasals) also the nasal cavity. When the cavities resonate, they radiate a sound wave which is the speech signal. Both cavities act as resonators with characteristic resonance frequencies, called formant frequencies. Since the mouth cavity can be greatly changed, we are able to pronounce very many different sounds.
In the case of unvoiced sounds, the excitation of the vocal tract is more noise-like.
Fig. 3 demonstrates the production of the sounds /a/, /f/ and /s/. The different shapes and positions of the articulation organs are obvious.
3. Speech Production by a Linear Predictive Vocoder
The human speech production can be illustrated by a simple model (Fig.4a). Here the lungs are replaced by a DC source, the vocal cords by an impulse generator and the articulation tract by a linear filter system. A noise generator produces the unvoiced excitation. In practice, all sounds have a mixed excitation, which means that the excitation consists of voiced and unvoiced portions. Of course, the relation of these portions varies strongly with the sound being generated. In this model, the portions are adjusted by two potentiometers (Fellbaum, 1984).
Based on this model, a further simplification can be made (Fig.4b). Instead of the two potentiometers we use a 'hard' switch which only selects between voiced and unvoiced excitation. The filter, representing the articulation tract, is a simple recursive digital filter; its resonance behaviour (frequency response) is defined by a set of filter coefficients. Since the computation of the coefficients is based on the mathematical optimisation procedure of Linear Prediction Coding they are called Linear Prediction Coding Coefficients or LPC coefficients and the complete model is the so-called LPC Vocoder (Vocoder is a concatenation of the terms 'voice' and 'coding'). In practice, the LPC Vocoder is used for speech telephony. It's great advantage is the very low bit rate needed for speech transmission (about 3 kbit/s) compared to PCM (64 kbit/s). For more details see Jayant/Noll (1984) and Deller/Proakis/Hansen (1993).
A great advantage of the LPC vocoder are the manipulation
facilities and the narrow analogy to the human speech production.
Since the main parameters of the speech production, namely the
pitch and the articulation characteristics, expressed by the LPC
coefficients, are directly accessible, the audible voice
characteristics can be widely influenced. For example, the
transformation of a male voice into the voice of a female or a
child is very easy; this will be demonstrated later in our
tutorial.
Also the number of filter coefficients can be varied to influence
the sound characteristics, above all, the formant
characteristics.
Fig. 5.
shows the simulation module of the LPC Vocoder as a block
diagram. The user can either record his or her own voice via
microphone or load samples of prerecorded speech.
The next steps are the LPC and the pitch analysis. Both, the set
of LPC coefficients and the pitch values are then stored in the
parameter memory. These parameters are needed to control the
synthesis part of the vocoder which is shown in the lower part of
the diagram. As mentioned earlier, the pitch values (pitch
contour) and the number of prediction coefficients can be changed
and these changes have a significant influence on the
reconstructed speech. We will now describe the different
presentation forms, selection procedures and manipulation
facilities.
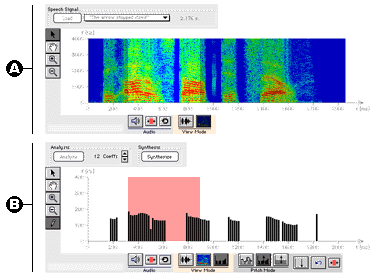
Fig. 6 presents the interactive user interface for our speech processing experiments.
Fig. 6: The vocoder simulation in its
entirety
| Reference speech signal The upper diagram
always displays the reference speech signal. It can be
displayed as time signal or frequency spectrum (visible speech
diagram). The reference speech signal can be recorded by
the user or be selected from a set of prepared speech
signal samples. |
|
| Analysis/synthesis panel The lower diagram displays the result of the LPC analysis and synthesis. The user can select the speech signal (either time signal or spectrum) or the pitch sequence as a bar diagram (this is shown in Fig. 6B). |
In all display modes each diagram can be scrolled and zoomed and
all these manipulations are always applied to both diagrams. Thus
the same portion of the speech signal is always visible in the
upper and the lower diagram. This is very useful for the
comparison of the reference speech signal with analysis/synthesis
results and the relations between time signal, frequency spectrum
and pitch sequence.
Every speech signal can be played back at any time, either as
a complete signal or as part of the signal. To set the portion to
play, an area of the speech signal can be marked with the mouse.
The selected portion is always applied to both diagrams. It is
thus easy to explore the relationship between the audible and
visual representations of a speech signal.
The basic operation of the vocoder simulation consists of 3 steps:
| Acquiring a reference speech signal | |
| Performing the LPC Analysis and Synthesis | |
| Manipulating the Pitch Frequency |
To acquire the reference speech signal, use the Speech
Signal control panel in the upper diagram panel.
There are two options: |
|
| a.) Recording your
own voice You can experiment with your own voice using a microphone attached to your computer.
Select Your own voice from the popup menu and
press the Record button. The maximum recording
time is 10 seconds. |
|
| Note: The recording feature requires the download and installation of additional software components. Please see the Technical Notes. | |
| b.) Loading a
prepared speech signal There is a set of prepared sample speech signals.
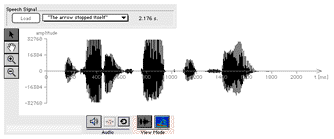
Fig. 8: Speech Signal control panel (if a prepared speech signal is selected) Choose a speech signal from the popup menu and press
the Load button. Once the reference speech signal is present, it is shown in the upper diagram in time signal display mode. Its length in seconds is also displayed in the control panel.
Fig. 9: Upper diagram panel with a
recorded/loaded speech signal |
|
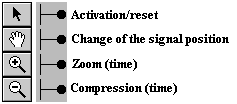
| c.) vertical
buttons
Fig. 10: Functions of the vertical bar If the arrow button (upper button) is
activated, a section of the speech signal can be
selected. Press the left mouse button, keep it pressed
and move the mouse according to the length of the section
which will be clearly marked by a red coloured area. |
|
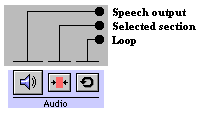
| d.) horizontal
bars and buttons
Fig. 11a: Audio bar For the acoustic output of the speech signal, press
the Loudspeaker button. The speech output can be
restricted to the selected (red coloured) area if chosen
(see c.) and the loop button replays the whole
speech signal or the selected area until the Loudspeaker
button is pressed.
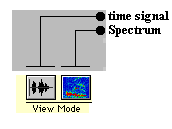
Fig. 11b: View Mode bar The View Mode buttons are self-explaining (selection between time signal and spectrum). It is important to note that the selected area corresponds to the same position in time and frequency domain. |
|
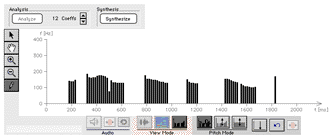
To perform the LPC analysis, use the Analysis/Synthesis control panel in the lower diagram panel.
Fig. 12: Analysis/Synthesis control panel Press the Analyze button and the LPC analysis of the reference speech signal is started. You can see the progression of the calculation by means of a growing bar. Once the LPC analysis is completed, one result -- the pitch frequency -- is shown in the lower diagram.
Fig. 13: Pitch frequency in the lower diagram panel Prior to the analysis you can set the desired number
of coefficients obtained by the LPC analysis. The number
of coefficients affects the quality of the synthesized
speech signal. The audible characteristics of a speech
signal are mainly determined by its formant structure. To
get a speech signal which sounds like the reference
signal, the LPC synthesis mainly has to reconstruct the
formant structure of the reference signal. Two
coefficients are needed for mouth radiation effects and
each additional pair of coefficients represent one
formant frequency. Since voiced speech sounds have up to
five formants, a reasonable number of coefficients is 12.
|
|
This
is the most complex (but also most interesting) part of
the tutorial. For the pitch frequency analysis, the reference speech
signal is split into short intervals of equal length. For
each interval a voiced/unvoiced decision is taken and the
pitch frequency is calculated in voiced regions. In the
simulation, the pitch frequency analysis is done by an
autocorrelation method. For more details see Hess (1983).
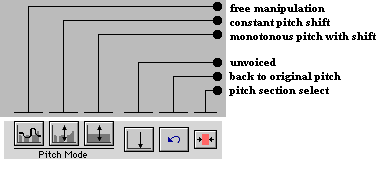
As shown in Fig. 14, several buttons, arranged in the bar Pitch Mode, exist for manipulation. They are activated by the pencil button in the vertical bar.
Fig. 14: Pitch manipulation bar In order to understand the manipulation procedures, please proceed as follows. It is assumed that you have produced speech (either with your own voice or by selection of one of the stored speech samples) and you have performed the LPC analysis and synthesis as described before. You have now the pitch sequence in the lower diagram panel and the arrow button (of the vertical bar) is activated. If you still have the time signal or spectrum, press the pitch button in the View Mode bar.
|
|
The tutorial, presented here, was produced with the aim to illustrate the principle of speech production and to awake interest for the fascinating area of speech communication sciences.
Although the tutorial covers a subject of the electronic speech processing, the main emphasis is put on the visual and acoustical explanation and illustration of the human speech production and on many possibilities to interactively manipulate the speech characteristics. It must be emphasized that the user of the tutorial should take the time to experiment with his or her voice in a playful way and to explore the interrelation between acoustic and visual phenomena of the speech.
As a very important extension, the tutorial can be a tool for speech therapists. They can record speech disorders and depict them as time signal and spectrum. For comparison, normal speech is shown simultaneously and the deviations are then obvious. Finally, persons with speech disorders, above all, deaf or hard of hearing persons (who very often have speech organs with full function) have a valuable support when they try to articulate and get the acoustic result for control as a spectogram.
The tutorial is embedded into the activities of the Socrates/Erasmus Thematic Network "Speech Communication Sciences" and it was funded by the European Network in Language and Speech (ELSNET).
References
| Deller, J.R; Proakis, J.G; Hansen, J.HL: | Discrete-Time Processing of Speech
Signals. Macmillan Publishing Company, New York 1993 |
| Fellbaum, K.: |
Sprachverarbeitung und Sprachübertragung. Springer-Verlag, Berlin 1984 |
| Hess, W.: |
Pitch Determination of Speech Signals. Springer-Verlag, Berlin 1983 |
| Jayant, N.S.; Noll, P.: | Digital Coding of Waveforms. Prentice-Hall, 1984 |